Monitors
Run the API tests you've already built—continuously, across regions, in CI, and inside your VPC.
Trusted by teams at







Automate the tests you're already running in Postman
Always-on visibility
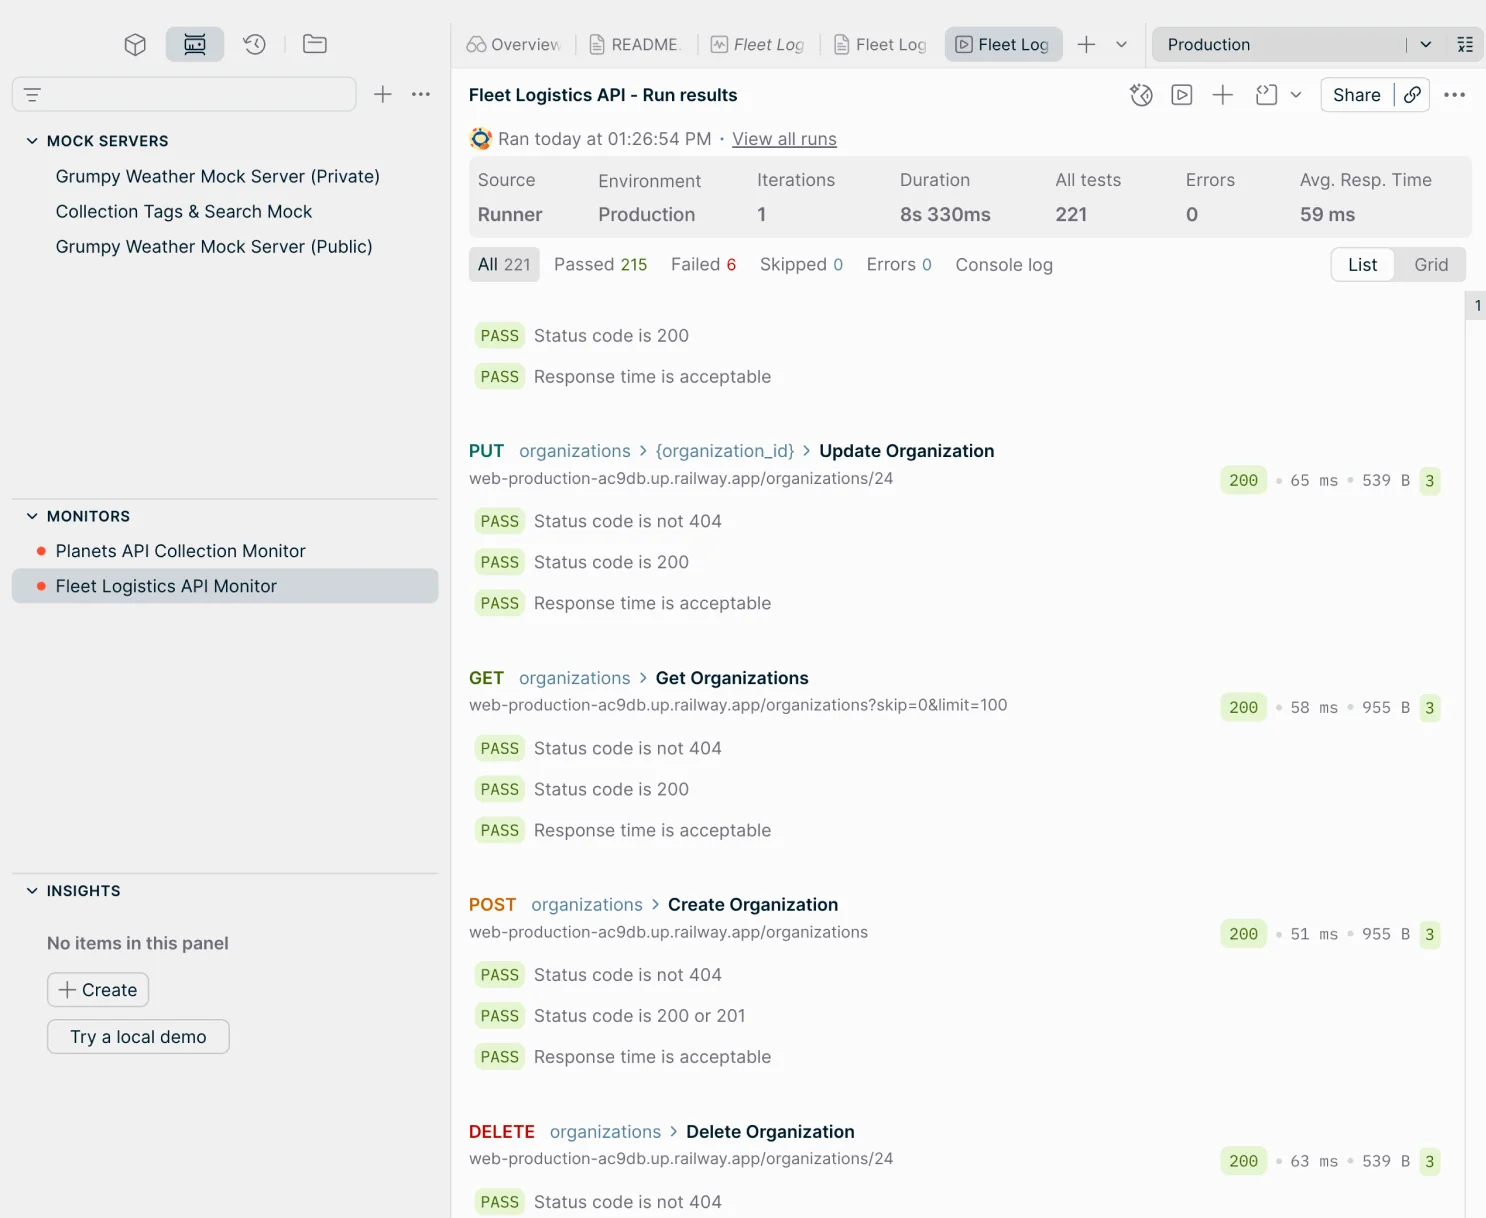
See pass/fail results, response times, and error rates for every test run across every environment, without having to run anything manually.
Multi-region coverage
Run monitors from multiple global regions to catch latency and availability issues specific to where your users are.
Run monitors where your APIs live
Deploy a Postman agent inside your VPC or private network to monitor internal APIs that aren't publicly accessible.
Identify, triage, and resolve issues with AI
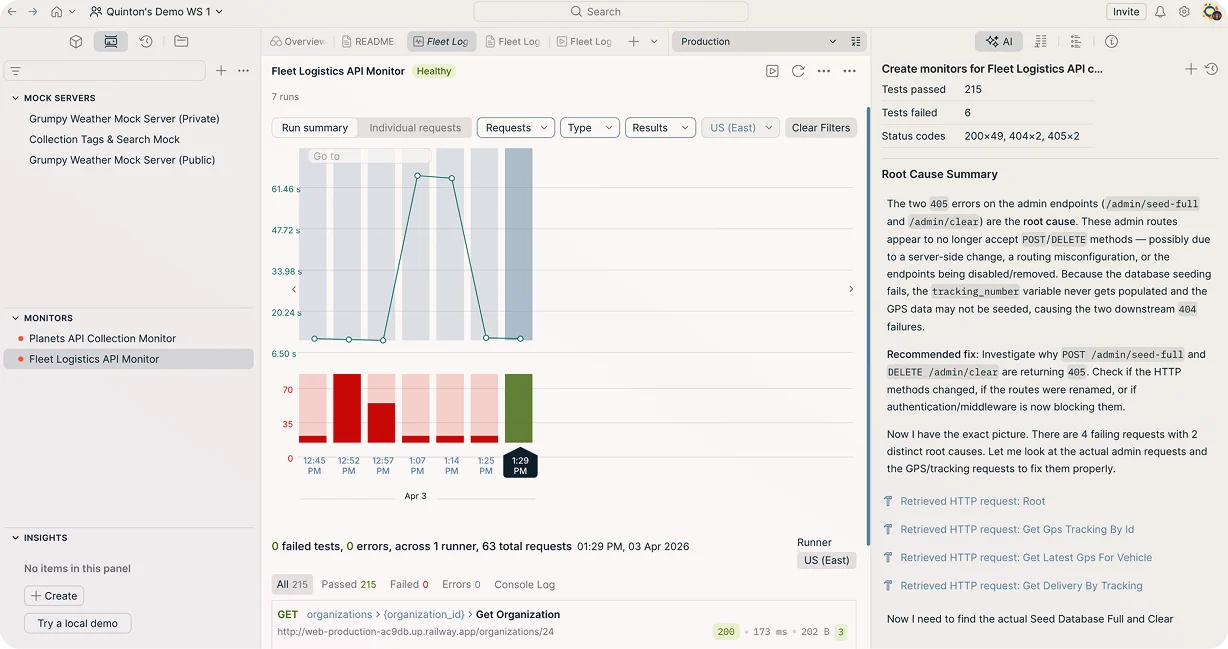
Postman AI reviews failed monitor runs, identifies the root cause, and recommends a fix so your team resolves incidents faster without having to dig through logs.
One of the things we love most about Postman is the Postman Monitor tooling with rich functionality out of the box. You can follow a simple tutorial and have a monitor up and running in five minutes."David Esposito, Platform Architect, BetterCloud


RESOURCES
Go deeper on API monitoring with Postman


Learn more about monitors
Chat with a Postman expert to learn how monitors can help you ensure your services run smoothly and quickly identify and fix issues before your API's consumers are affected.